
Universal Time Series Models, The AI Scientist, and Improved Reliability Diagrams
PandaScore Research Insights #17


MOIRAI: Universal Time Series Forecasting Model
What it is about: This paper introduces MOIRAI, a Universal Large Time Series Model designed to handle diverse forecasting tasks, moving beyond the traditional one-model-per-task approach.
How it works: The focus is on probabilistic forecasting, where the model predicts the parameters of a probabilistic distribution tailored to each time series.
This paper addresses 3 major issues related to universal time-series forecasting:
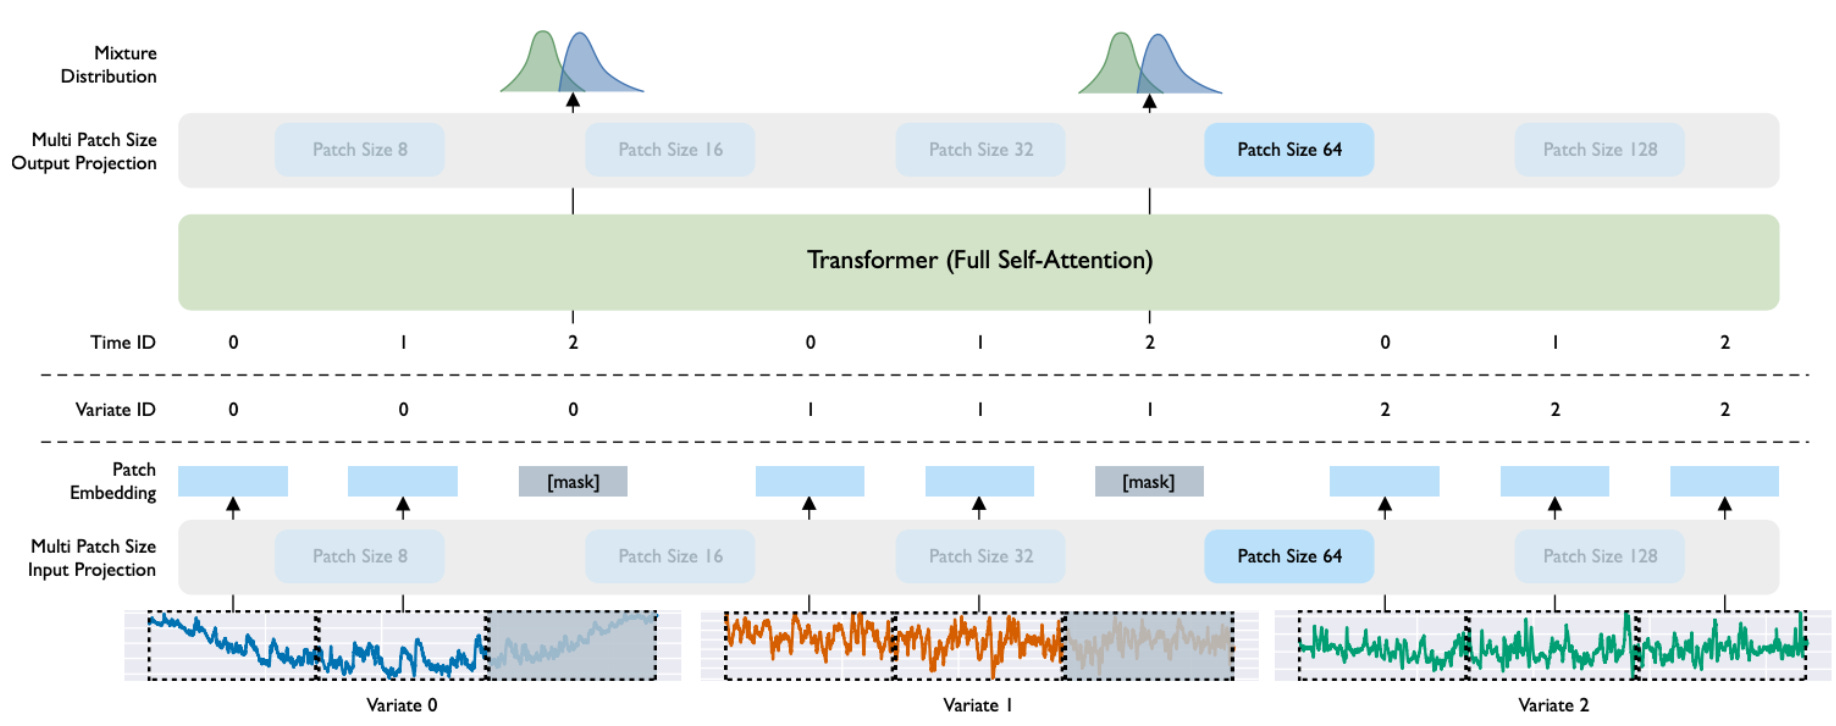
Cross-frequency learning: Time series can have various frequencies thanks to multiple patch-size projection layers. The model is trained with several path-sizes, and the user can configure the patch size for their use case at inference time.
Multivariate time series: To accommodate an arbitrary number of variates, the authors introduce an any-variate attention mechanism, in which they “flatten” all variates into one dimension and handle them as a single sequence.
Diverse distributional properties of data: The authors construct LOTSA, a large-scale dataset comprising 27 billion observations spanning 9 domains. This dataset serves as a robust foundation for training and evaluating the model. Additionally, they integrate a mixture distribution into the model’s design, enhancing its ability to produce flexible and accurate predictive distributions.
What they found out:
The use of multiple patch-size projection layers enables the model to perform well across time series with different frequencies, achieving state-of-the-art results in most scenarios.
Ablation studies show that employing a mixture distribution significantly enhances the model’s ability to capture complex patterns in multivariate time series compared to using a single distribution.
Limitations:
The current architecture struggles with high-dimensional time series since all variates are flattened into a single sequence. Extending the Transformer input length can alleviate this issue.
Extending the model to handle multi-modal inputs (e.g., combining tabular data or text) is an intriguing but unexplored direction for future work.
Why it matters: Probabilistic time series forecasting is essential in fields like energy and weather forecasting. Historically, each domain required its own specialized models trained on domain-specific data, making it difficult to adapt to new data distributions. A universal model like MOIRAI is particularly valuable in domains with limited data, as it allows for broader generalization and reduces the need to train models from scratch.
Our takeaways: As practitioners interested in probabilistic forecasting, we found this paper highly relevant. It offers a promising approach for multivariate time series forecasting without requiring extensive retraining. However, we are uncertain about its application to esports as the underlying time-series seem to be more stochastic than the ones used to train MOIRAI.
The AI Scientist
What it is about: The AI Scientist is the result of a collaboration between researchers from the University of Oxford, the University of British Columbia, and the start-up Sakana AI in summer 2024.
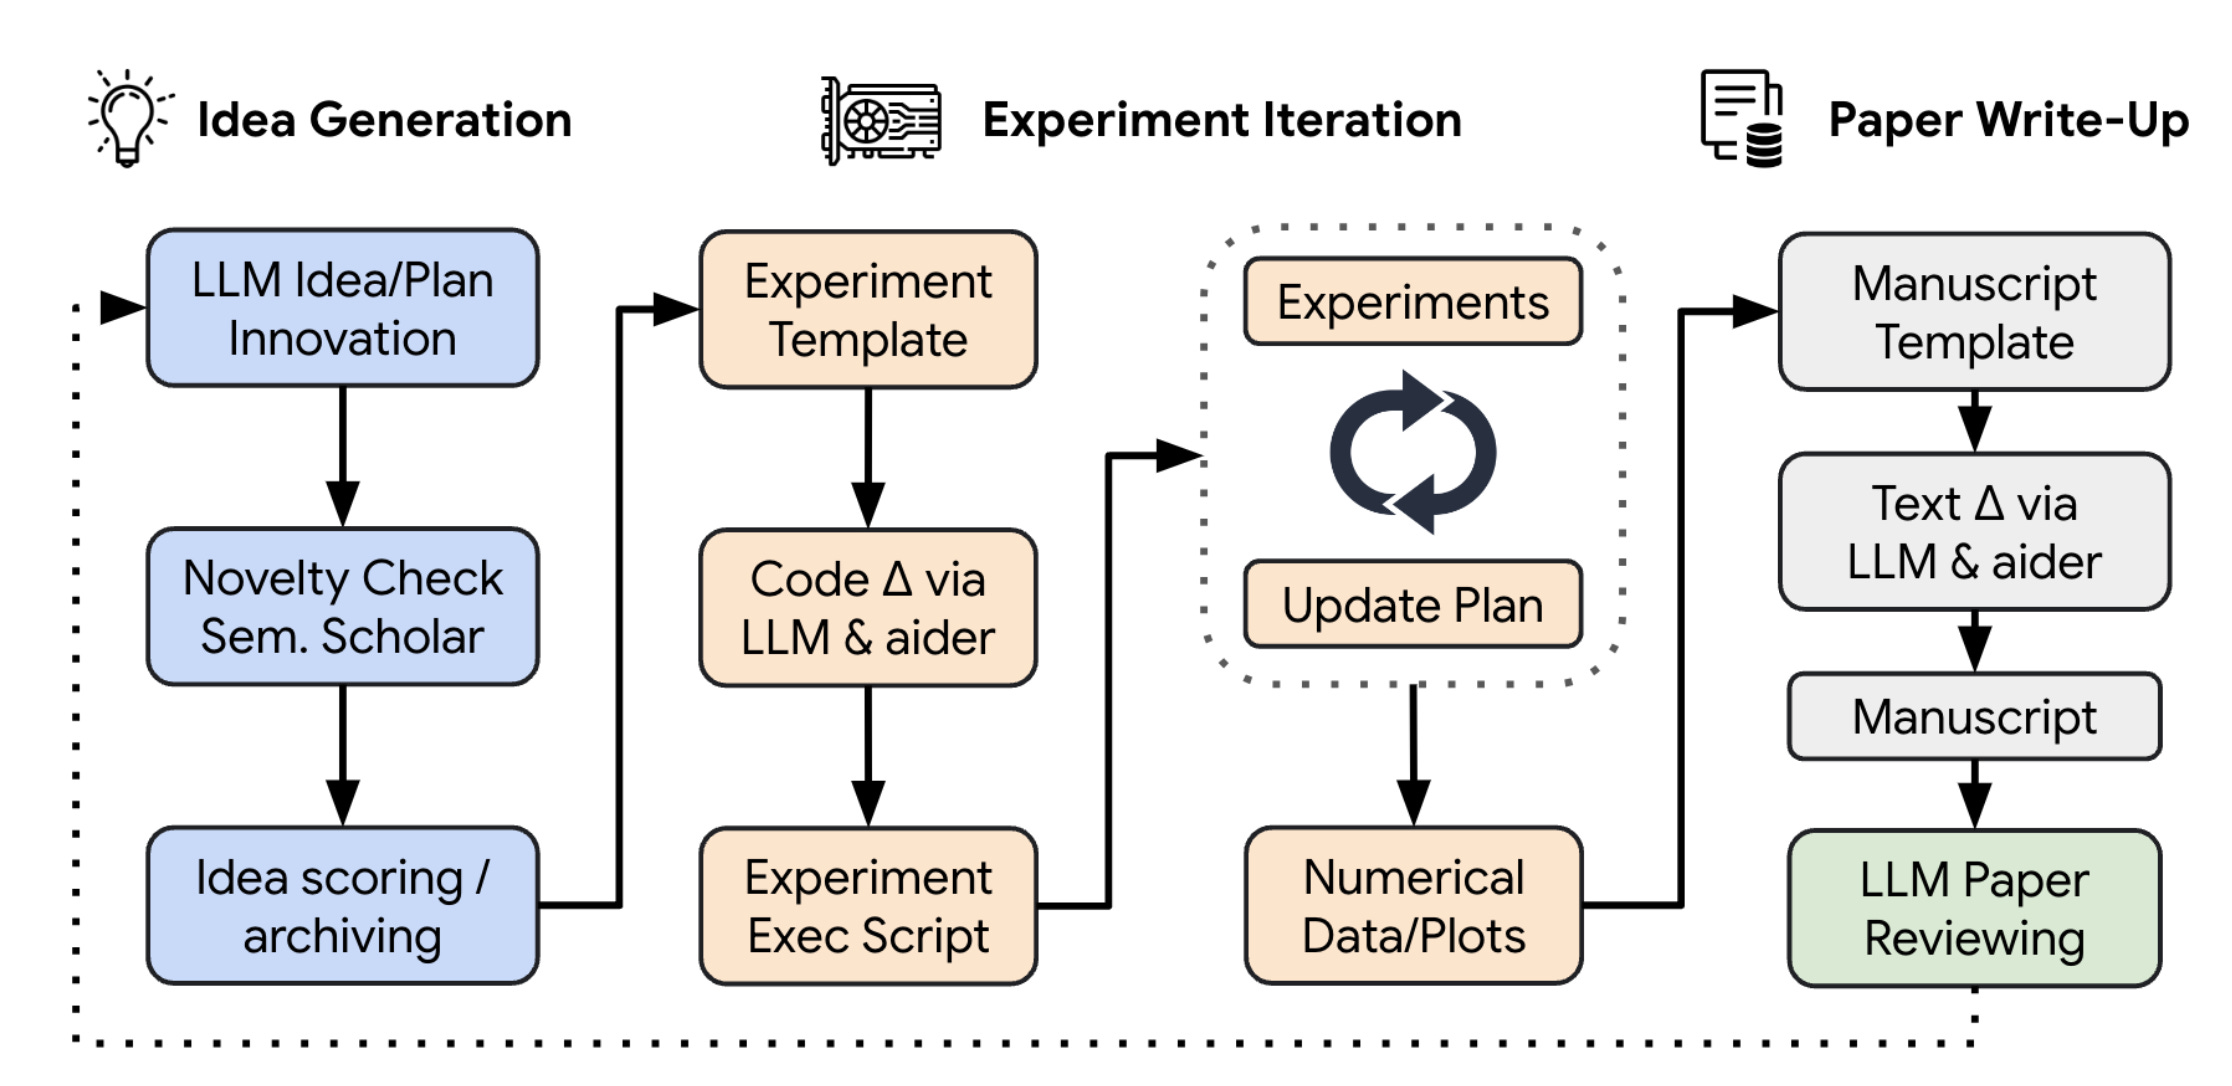
How it works: The paper explores the construction of a pipeline capable of producing scientific discoveries autonomously. With the help of current state-of-the-art LLMs, they organized a map of prompts and sequences to follow in order to write an academic scientific paper with minimal human supervision. Their pipeline is divided into 3 main parts: Idea Generation; Experimental Iteration; and Paper Write-Up. In a nutshell, multiple LLMs are used simultaneously to produce answers, which are then reviewed by other LLMs and re-injected into subsequent rounds of self-refinement of prompts and answers.
Results: To be able to assess the quality of produced papers, they developed a model (also LLM-based) to assign scores similar to those used in typical academic conference reviewing. These scores are calibrated so that papers scoring a 6 are labeled as “weak accept,” meaning they are just above the threshold for publication. Using this scoring system, the best AI Scientist papers obtained scores around 5 and 6, which would not be immediately discarded by reviewers. Here is an example of such a paper entirely written by The AI Scientist.
What they found out: Even though the current quality of the papers produced is, on average, below what is required for publication, the authors have shown that some level of automated scientific discovery is likely possible in the near future.
Why it matters: This could potentially disrupt an area still considered difficult for AI—the creation of scientific discoveries.
Our takeaways: We believe that having unlimited papers flooding conference reviewing processes could significantly lower the overall quality of research publications. "Publish or perish" remains a serious issue in academia, and providing tools to automatically generate papers may be problematic. On the other hand, scientific discovery is beneficial to society, and the advantages could ultimately outweigh the drawbacks.
Increasing the Reliability of Reliability Diagrams
What it is about: This 2007 paper introduces improvements to reliability diagrams through statistical techniques that better account for uncertainties, resulting in more accurate and interpretable evaluations.
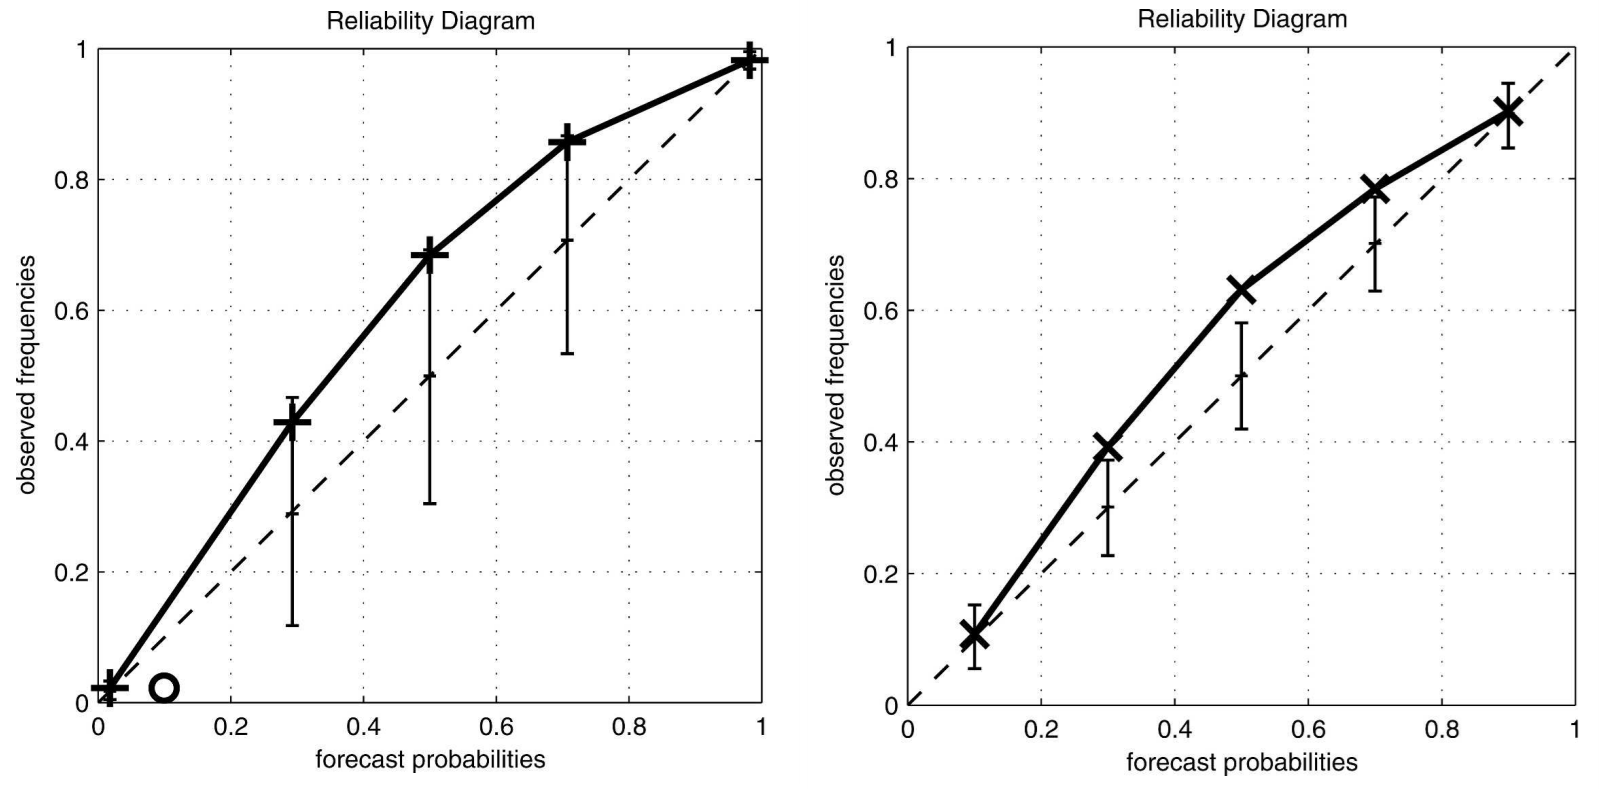
How it works: Reliability diagrams are tools used to assess how well probabilistic forecasts align with reality. In simpler terms, calibration measures whether events predicted with a certain probability (e.g., "70% chance of winning") occur as often as expected. A reliability diagram visualizes this by plotting observed event frequencies against forecast probabilities, where perfect calibration results in points aligning along the diagonal.
Traditional Reliability Diagrams: In classic diagrams, error bars are often used to show uncertainty in the observed frequencies for each forecast probability bin. These error bars, such as those generated using bootstrapping (estimating statistics by sampling with replacement), reflect only variations in the observed data and assume fixed binning and sampling.
The Paper’s Innovations:
Consistency Bars: Compared to traditional error bars that focus solely on observed data variations, consistency bars account for uncertainties under the assumption that the forecast is reliable. They use a resampling technique that considers both the variation in the bin means (forecast probabilities) and the sample sizes. This method highlights whether observed deviations are consistent with a reliable forecast system.
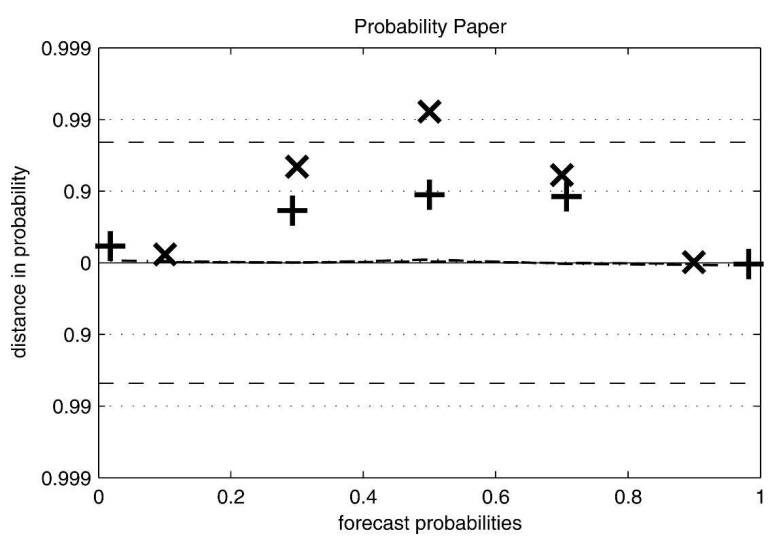
Probability Paper Representation: The observed frequencies are re-plotted as probabilities of falling within expected reliability bounds.
Results: The authors tested their methods on synthetic datasets and real-world weather forecasts at Heathrow Airport. They demonstrated that seemingly "better" forecasts under traditional diagrams could actually be less reliable when examined with their new methods, revealing flaws missed by conventional techniques.
Our takeaways : Calibration is critical for accurately setting odds that reflect reality, especially in esports, where match dynamics are complex and outcomes often depend on small probabilities. We've previously explored this topic in our articles on mitigating bias in calibration error estimation and estimating the expected calibration error. By adopting these refined reliability diagrams, we can better evaluate the accuracy of our probabilistic models and ensure our odds are not only competitive but also statistically sound.
 | A guest post by
|
 | A guest post by
|